This is the second article on Spring Session Redis. In the previous article, I explain the ideas behind the framework and provide a quick demo.
In this article, I will provide some of the best practices and production considerations when deploying an application backed by Spring Session Redis.
Redis Master/Slave Setup
At a minimum, Redis should be deployed in a master-slave configuration. A single instance is obviously a single point of failure to any system.
Master-slave would allow the system to failover to a different instance in case the master is having problems or is unavailable.
Redis uses the notion of Sentinels to identify who is the current master. Think of Sentinels as bystanders who keep checking the health of the actual master or slave servers. When an issue is identified with the master, the Sentinels basically cast a vote on which slave should be promoted to become the new master. I won’t go into all the details in this article, but the following link provides in-depth explanation of the options you have. At a minimum, you should setup a configuration of one master and two slaves, all on separate machines/VMs.
 +----+
       | M1 |
       | S1 |
       +----+
          |
+----+    |    +----+
| R2 |----+----| R3 |
| S2 |         | S3 |
+----+         +----+

Configuration: quorum = 2
Spring Session Redis uses the Spring Data Redis framework to talk to Redis. This means that the same considerations and best practices are applied to both frameworks.
When you use a sentinels-based configuration, you do not provide the redis host/port information to spring data redis. Instead, you should provide the property for the master server and a list of sentinel URLs. Each sentinel process has its own configuration file that lists the master redis server. For example:
sentinel monitor mymaster 127.0.0.1 6379 2
sentinel down-after-milliseconds mymaster 60000
sentinel failover-timeout mymaster 180000
sentinel parallel-syncs mymaster 1
There is no need to specify the slaves in the config, as those are auto-discoverable. Again, see here for complete details. Once you configured your master, slaves and sentinels, you will need to change the spring data redis configuration in your application to work with the sentinels instead of host/port. For example, on a local machine it would look like this:
spring.redis.sentinel.master= mymaster # Name of Redis server.
spring.redis.sentinel.nodes= localhost:6379, localhost:6380, localhost:6381 # Comma-separated list of host:port pairs.
Redis Cluster Setup
A different approach is to use a Redis cluster, where means you will have multiple master servers. The data is essentially sharded/partitioned across all the available masters, which increases the performance of the database since each node only has to deal with a subset of the requests. A good tutorial for redis cluster setup is available here.
Redis Labs provides an enterprise version of Redis. It also provides the ability to interact with the cluster via a DNS proxy. This greatly simplifies things on the client side, since you no longer need to know the topology of the cluster, thus letting you make changes to the database without changing the clients. All you really need to provide to with such a setup is the Redis proxy host and port. You can download a trial version of redis labs here.
Pool Settings
Let’s have a look at the available spring application properties for Spring Session Redis:
Note: I recommend bookmarking the “spring common application properties” page. There’s a ton of useful tweaks and configuration details there.
Spring Data Redis uses a JedisConnectionFactory to manage its connection pool. The relevant pool settings from above are max-active, max-idle, max-wait and min-idle. These define how many connections will be open to the Redis database.
- I recommend leaving a min-idle setting of at least 8 if possible. Creating a connection is an expensive operation, and you might timeout waiting for a connection to open if your max-wait setting reasonably low.
- max-active should be set to at least the number of available tomcat connections you configured (default of 200 in a spring boot tomcat server). For every server request, each thread starts by validating the incoming request against Redis, so in a server where all threads are utilized, all would require access to Redis at the same time. You don’t want to wait in a blocking queue.
- spring.redis.timeout defines the wait time for an actual query to be executed and returned. You should set this to a reasonably low number to prevent your connection pool from filling up in case all connections are waiting for a response. Too low of a number and you might be getting JedisConnectionTimeout exceptions unnecessarily, which means — a user would get kicked out of the system. A value of 1000 milliseconds is a good starting point for performance testing.
Metrics
Spring Data Redis uses a JedisConnectionFactory connection pool to talk to Redis. Behind the scenes, this framework simply uses an Apache Commons GenericObjectPool (source is available here).
It is critical to be able to monitor the status of the pool in a production environment. Most importantly, it’s important to know if the number of used connections passes a certain threshold, as this may indicate a problem.
Spring Boot Actuator is spring’s production-ready monitoring solution. Among others, it exposes a /metrics endpoint containing valuable information. Unfortunately, The JedisConnectionFactory object pool is not a part of that information.
However, actuator is extensible. And lucky for us, someone already took the time to write a Redis pool extension to actuator. You can download the source code from here: https://github.com/nysd/spring-boot-redis-metrics. Although the README is in Japanese, the implementation is pretty straightforward. Simply add the following dependency and repository to your pom.xml (or compile the source code yourself):
<dependency>
<groupId>spring.support</groupId>
<artifactId>spring-boot-redis-metrics</artifactId>
<version>1.3.1</version>
</dependency>
...
<repository>
<id>nysq</id>
<url>http:
</repository>
The result is additional monitoring entries in the /metrics API:
curl localhost:8080/metrics/redis.*
{
  "redis.someConnectionFactory.active":20,
  "redis.someConnectionFactory.idle":80,
  "redis.someConnectionFactory.usage":0.25
}
Database Monitoring
If you plan to use the open source version of Redis, you will not get any fancy dashboards or time-based valuable information. Redis Labs enterprise provides a very useful monitoring dashboard in a production environment:
If you do decide to go the open source route, remember that Redis is a single-threaded application. Monitoring the machine or VM that runs your Redis database might provide unreliable results. For example, if you run Redis on a dual-core machine, the VM would report a 50% CPU utilization at max load, while the Redis process itself may report 100% CPU utilization. If you were to run Redis on a quad-core machine or VM, the VM would report a 25% CPU utilization, while the Redis process itself is actually already maxed out at 100%. Make sure you monitor the Redis process itself.
Monitoring Commands
Redis has some commands that should never be used in a production environment.
- KEYS * runs over all the keys in your DB and counts their total. Again, Redis a single-threaded database. This means that during this expensive process, the DB is unresponsive to your application! NEVER run this command in a production environment.
- SMEMBERS is a command that returns the values stored per key in a given set. If the purpose of running the command is simply to count the number of active sessions, do NOT use this command. Its cardinality is O(n) (similar to KEYS command above), and could “stop the world” in the middle of your production. Based on your Spring Session setup, you might have a set with the key
FindByIndexNameSessionRepository.PRINCIPAL_NAME_INDEX_NAME that can hold all / many of the sessions in the system, which makes this command not very different than KEYS.
- SCARD is a command that returns the size of values in a given set, and has a cardinality of O(1). Therefore, it can be used safely in a production environment.
- INFO command provides a wealth of information about your database and can be safely used. One of the more interesting items is instantaneous_ops_per_sec. This indicates the amount of operations Redis is performing per second. It’s an important item to monitor to identify unexpected increase in load.
Spring Session Cron Job
I saved the best (or worst) for last. There’s an implementation detail in the framework that you should be aware of before deploying to a production environment. I think the best way to explain it is with an example.
I’ll start by running our demo project in a test machine. I’m running one Eureka server, one Config server, one gateway and one order-management microservice.
For this simulation, I changed the server session timeout to be only 2 minutes instead of the default 30 by adding the following to the start script:
mvn spring-boot:run -Dspring.redis.host=localhost -Dspring.redis.port=12000 -Dserver.session.timeout=2 -Dserver.port=0
When I go to the Redislabs monitoring dashboard, the graph is quite boring:
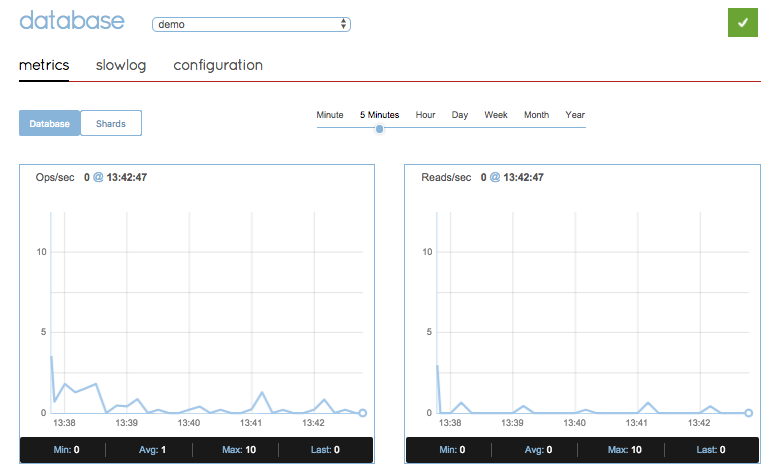
Redislabs monitoring with a single instance of each microservice.
Now, I’m going to add more server instances, so that I’ll have 8 gateways and 8 order-management instances. This is not entirely representative of a performance testing environment since I’m running on a single test machine, but the change is immediately clear:
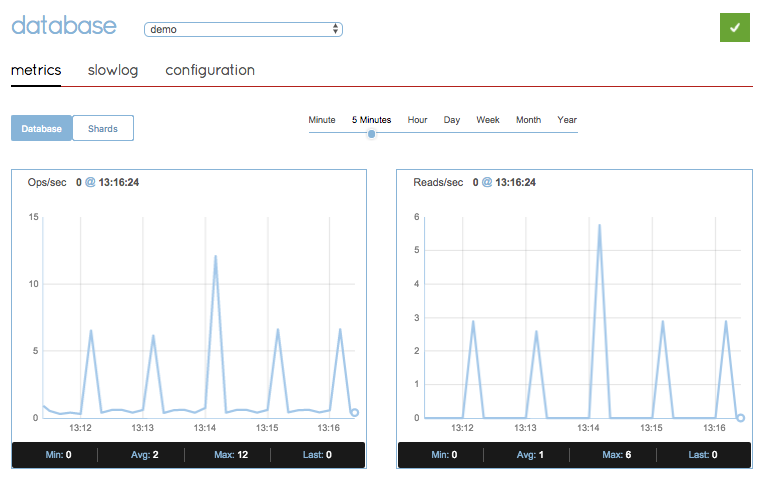
Redislabs monitoring with 8 gateways and 8 order-management instances
Wow! What just happened? The servers should be completely idle, since there are 0 connected clients. And yet, every minute, on the minute, there is this small spike of reads and ops per second. Nothing to be alarmed about, I’m sure… or is it?
Now, let’s start logging in to the system indefinitely. I’m going to use a simple curl command for that, and I’m going to do all the logins from a single thread, to create a steady, predictable stream of logins to the system. Also — I’m only logging in to a single instance out of the 8 gateways.
for ((i=1;i<=10000000;i++)); do curl -s -u gateway:password localhost:8080/login >/dev/null ; done
My expectation would be an increased load on Redis, that would eventually even out to a simple, predictable flat line representing the incoming requests. What I actually got is this:
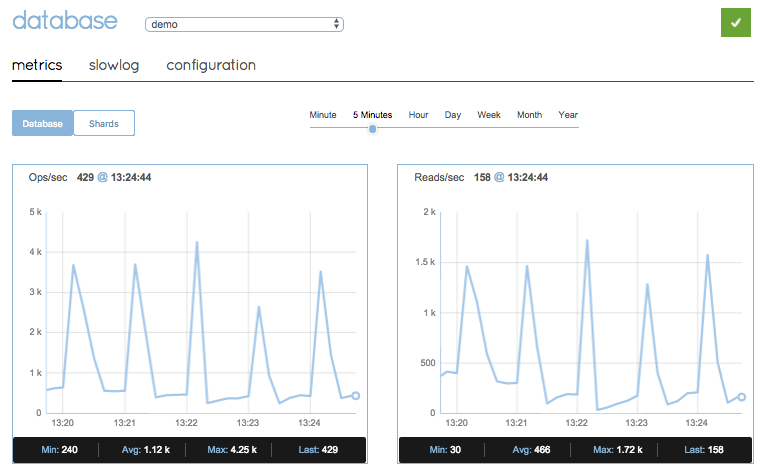
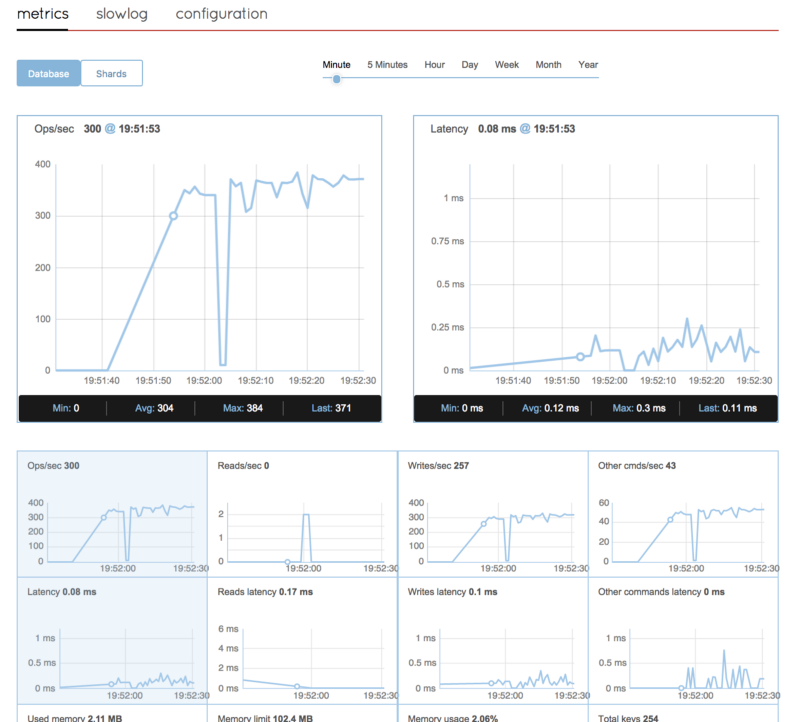
Redislabs monitoring with 8 gateways, 8 order-management instances, steady stream on login attempts
Looks really suspicious, isn’t it? Once again, every minute, right around the :00 seconds mark, there’s a sudden spike of ops per second and reads per second to Redis. As you can see, the spikes are now much more worrying. It is no longer a spike from 0 to 5, it’s a spike from around 700 to almost 4000 ops per second. If we’ll view the “other commands” graph, we’ll see a similar pattern, indicating that some of these commands are not reads or writes:
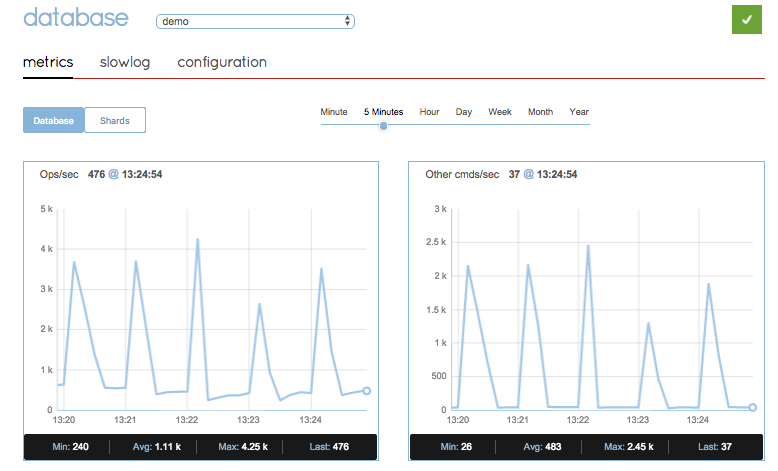
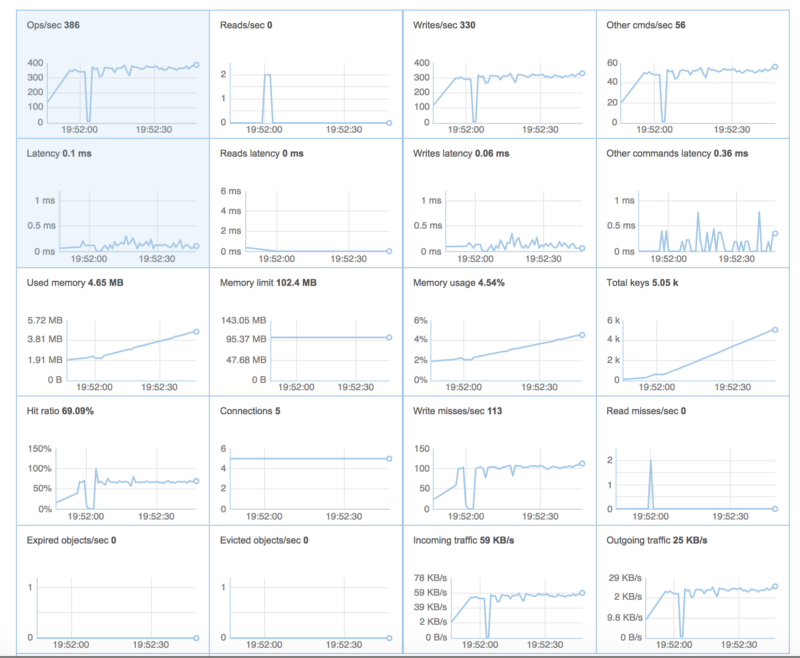
Redislabs “Other Commands” monitoring with 8 gateways, 8 order-management instances, steady stream on login attempts
What’s going on here?
To understand this, we need to go deeper into the source code.
Spring Session Redis configures the system in a Spring Repository class called RedisOperationsSessionRepository. It handles many aspects of the framework, among them is how to cleanup expired sessions:
As you can see, the cleanupExpiredSessions method is scheduled to run every minute. This means that every minute, at the same second, all the instances you have in a production environment would connect to Redis at the same time. What would they do in this cleanExpiredSessions() method?
This block of code:
- Rounds down to the last minute
- Loops over all keys that expired since then, and deletes them from Redis (We now know what those “Other Commands” were in the graph).
- “touches” the session to make sure it is deleted. In Redis, a key is either lazily expired upon the next access to it, or passively by randomly reading keys in the database.
Again, this is done from every instance connected to Redis, and at the same time.
You might be wondering why we even need this implementation. As mentioned in the previous article, Redis can self-expire its keys and indeed there is an expiration set for the sessions.
The reason is that Redis does not guarantee exactly when these keys would get deleted. It is possible that a long time would pass without any access to this session, which means it would not get deleted long after it actually expired. Although this might not seem like a problem (the session would immediately expire upon the next access), there are SessionExpiredEvent listeners that developers might have implemented that are expected to execute immediately once the session expires (to cleanup web sockets, for example). Therefore, the framework tries its best to expire the key closest to the actual expiration time.
But wait, there’s more!
We’re not done yet.
There’s a listener created in the @Configuration class RedisHttpSessionConfiguration, that is registered to receive deletion and expiration events from Redis. The relevant source code is below. redisMessageListenerContainer creates the listeners, while setConfigureRedisAction tells Redis to notify this particular calling client (the server instance) on any key deletion or expiration:
Going back to RedisOperationsSessionRepository, we see the following code:
That’s a lot of code to digest, but the gist of it (no pun intended) is as follows:
- onMessage method is invoked on every deletion or expiration of a session.
- Inside, it again connects to Redis to get the session details of the key that is about to get expired/deleted.
- It then publishes a SessionDeletedEvent or a SessionExpiredEvent, to allow a user to customize the deletion/expiration with a handler bean. Spring documentation describes this as a place where you might want to cleanup Web Sockets, if you happen to use them.
So, to recap:
- Every minute, each server instance would connect to redis to delete all expired sessions. As you might expect, that’s a lot of redundant calls, since only the first server would actually achieve this purpose.
- Redis would then notify every instance that the session was deleted.
- Each server instance would then connect to Redis to get the session details of the expiring session.
That’s a lot of activities done at once. Let’s do a little a real-world calculation for a production environment:
If we happen to have 100 server instances, and we have 2,500 sessions expiring every minute (a fairly common production use case), this means that every minute there would be at least 500,000 calls to Redis at the exact same second!
This can become a serious problem, and you’re probably beyond the capacity of a typical Redis cluster.
But there’s an even bigger problem.
Usually, in order to support increasing load — you add more server instances to a production environment, perhaps even with auto-scaling in some cloud environments. However, at its default setup, the more servers you add to a production environment, the worse the problem becomes, and you put your production at an even greater risk.
Note: I opened a github issue on this item. The team responded that they added a property to change the cron schedule if needed, and believes it is important to keep the listener configuration in place to allow for custom expiration handling by developers. I completely respect that, however you as a developer should be aware of this tradeoff.
Mitigation
There are a few ways to address this concern:
- As you saw in the above code examples, in the latest versions of Spring Session (1.3.1 is the latest release version as of this writing), there’s a way to override the 1 minute cron schedule default. In previous versions it was hard coded to 1 minute, so at least we now have the ability to change it. Still, the cron would be triggered on all instances at the same time which is still undesirable in my opinion.
- If you don’t care about having some sessions linger in the database longer than its original expiration, simply set this cron job to an impossible value. One way to do this is to set it to an unrealistic date such as February 31st. In your configuration, you can add something like this:
spring.session.cleanup.cron.expression=0 0 5 31 2 ?
If you don’t care about being notified when sessions expire (i.e., you don’t have a custom implementation that needs to execute whenever a session expires), you can disable the event notifications from Redis.
Note that you must disable them on ALL servers of all types. If even one of these servers changes the Redis database config to enable notifications, all connected clients (all your servers) would still receive the expiration events. The way to disable this is by changing the ConfigureRedisAction from the default to a NO_OP implementation:
If you DO want to implement a custom session expiration/deletion event handler — it gets a little tricker.
What you want to do is disable the message listener on all servers except one. Develop a specialized microservice that would only handle the session expiration events. Remember that all your instances are connected to the same Redis database, so this specialized microservice would receive all session expiration events. This specialized microservice “daemon” would have a single instance in a production environment, or maybe two to support failover. The main idea is to have a minimal number of instances handling the session expiration events to allow the rest of the system to function properly. Once you setup the specialized microservice, you can disable the listener on all other servers, like this:
Note: the new milestone 2.0.0 version of Spring Session Redis appears to have removed the @Scheduled cron annotation, however it appears to just be configured differently. I’ll update this article if 2.0.0 provides a simple way to disable the cron entirely.
Conclusion
In this article I explained some of the production considerations when deploying an application backed by Spring Session Redis to a production environment. It is always important to do serious performance testing. I would recommend using tools that provide good monitoring visibility. As you saw above, this is something that can easily go unnoticed without a graph-based monitoring tool.
Good luck, and happy coding!
Oded Shopen